Original Research
Evaluating Uncertainty in Dengue Seroprevalence in the Absence of a Gold Standard Diagnostic Test
Tess Baker1, David B. Wolfson1
Published online: 7 October 2020
1Department of Mathematics and Statistics, McGill University
Corresponding Author: Tess Baker, email tess.baker@mail.mcgill.ca
Abstract
Background: Shortly after the introduction of the first licensed vaccine against dengue fever (Dengvaxia), a serious outcome was attributed to the vaccine: vaccinated individuals without a previous dengue infection were at increased risk of developing severe dengue if subsequently infected by a heterologous serotype. In response, the World Health Organization recommended vaccination in regions where the seroprevalence of dengue is at least 50% and, ideally, greater than 70%. Hence, accurate estimates of regional seroprevalence are crucial for both population vaccination strategies and test-then-vaccinate decisions at the individual level. Currently, estimates of seroprevalence are based on surveys, using screening tests for previous dengue exposure. These estimates must consider the sensitivity and specificity of the tests, which depend on identification of those who have been exposed, ostensibly through a test, regarded as the gold standard. There is, however, no easily accessible gold standard test for dengue.
Methods: We propose an approach to estimate the seroprevalence of dengue that does not require a gold standard test by modeling: (i) the uncertainty in the sensitivity and specificity, and (ii) the uncertainty in the “true” disease prevalence.
Results: Through simulations, we demonstrate the effect of these extra sources of uncertainty on post-test estimates of dengue seroprevalence. Our simulations show, for example, that in a population of 1 million it is possible to overestimate or underestimate the number who are truly seropositive by as much as 76,000.
Conclusions: Current estimates can substantially overestimate or underestimate the true probability of previous exposure when these extra sources of variability are not accounted for.
Tags: dengue, dengue vaccine, simulation, seroprevalence survey, sensitivity and specificity, latent class models
Introduction
Dengue fever is the most common arbovirus infection globally, infecting approximately 390 million people each year, and is endemic in more than 100 countries (1, 2).The virus, which has four distinct serotypes, is unusual in that infection with one serotype does not confer long-term immunity against the other three (3). On the contrary, a secondary infection by a heterologous serotype is often far more severe than primary dengue infections–a phenomenon known as antibody-dependent enhancement (4).
The tetravalent vaccine, Dengvaxia, has now been licensed in over 20 countries for 9-45 and 9-60 year-old individuals (5). However, it was discovered that individuals without a previous dengue infection who had been vaccinated were, in fact, at an increased risk of developing severe dengue following their first infection (6–7).
This peculiarity led to the WHO Strategic Advisory Group of Experts (SAGE) recommending either a test-then-vaccinate strategy, whereby individuals are tested for a prior dengue infection before getting vaccinated, or that Dengvaxia only be introduced in regions where the seroprevalence is at least 50% and, ideally, greater than 70% (5). In these high transmission settings, the vaccine is believed to lower the overall burden of disease while remaining cost-effective; these benefits drop off where the seroprevalence is less than 50% (8). Hence, accurate estimates of regional seroprevalence are crucial for vaccination strategies at the population level as well as for test-then-vaccinate decisions at the individual level.
Currently, estimates of seroprevalence are based on surveys, which use screening tests–primarily the IgG enzyme-linked immunosorbent assay (ELISA)–to determine prior exposure (11). However, these tests are currently unable to differentiate between the four dengue serotypes (9–10). Additionally, the vaccine does not confer equal protection against all four infecting serotypes; it only offers significantly higher protection in two of the four viral strains (8, 12). Therefore, despite vaccination, protection against the other two is not only incomplete, but subsequent infection by one of these serotypes could be regarded as a secondary–and thus more dangerous–infection in someone who has been vaccinated (13). Similar to a secondary infection that occurs from natural exposure, this trend is thought to be due to antibody dependent enhancement (14). We elaborate briefly on this phenomenon in the Supplementary Material.
Additionally, seroprevalence estimates need to consider the sensitivity and specificity of the test, which must be estimated from available data. Sensitivity and specificity are estimated, respectively, as the sample proportion of people with previous exposure who test positive and the sample proportion of people without previous exposure who test negative. However, tests with imperfect sensitivity and specificity are prone to false positives and false negatives, and hence a gold standard test is needed to properly identify those who have truly been previously exposed. There is no easily accessible gold standard test for dengue that can be applied at the point of care (15).
Here, we propose the use of latent class models as an approach to assessing previous dengue exposure in a population that does not require a gold standard test by modelling the two main sources of extra uncertainty from the lack of a gold standard: (i) the uncertainty in the sensitivity and specificity and (ii) the uncertainty in the “true” disease prevalence.
Uncertainty in the sensitivity and specificity arises from external factors such as laboratory technique, sampling season, and the tendency of dengue antibodies to cross-react with antigens from other closely-related flaviviruses, and may be additionally perpetuated by biases arising when diagnostic tests are not adequately evaluated in clinically relevant populations (spectrum bias) (16–20). Uncertainty in the seroprevalence, on the other hand, is perpetuated by sub-optimal screening tests and is additionally influenced by a lack of standardized reporting procedures and diagnostic criteria (21). Additionally, if the study population is not representative of the target population (due to non-random sampling, for example), the seroprevalence may be additionally affected by selection bias (22).
Previous studies have investigated the effect of uncertainty on test sensitivity and specificity as well as on the prevalence from both a theoretical and more applied perspective. For example, Imai and Ferguson (2018) took a simulation-based approach to explore how seroprevalence survey design affects estimates of dengue transmission intensity (23). Implicit in their approach is the recognition that there is inherent uncertainty about the prior prevalence, that is, the pre-test probability of dengue exposure. Likewise, Panngum et al. (2013) utilized Bayesian latent class models to estimate the true accuracy of dengue diagnostic tests when easily accessible gold standards are unavailable, and similarly, Speybroeck et al. (2011) evaluated uncertainty in the test sensitivity and specificity in multiple diagnostic tests to estimate malaria prevalence in Peru, Vietnam, and Cambodia (24–25).
In this paper, we demonstrate the simultaneous effect of uncertainty in both the test sensitivity and specificity as well the prior dengue prevalence on post-test estimates of dengue seroprevalence through simulations based on a formal hierarchical latent class model. Our simulations emphasize the importance of taking into account these extra sources of uncertainty when estimating dengue seroprevalence, which can be used in the absence of a gold standard test. We therefore advocate the use of latent class models when estimating the prevalence of dengue. Additionally, this approach is especially useful in the context of deciding whether or not to implement the dengue vaccine at a specific location and/or time.
Methods
Let
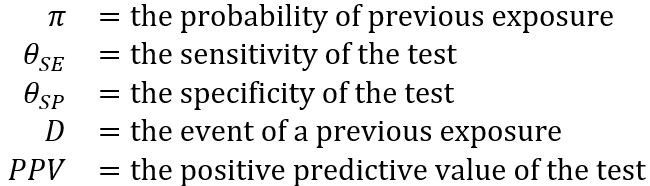
It is well known that

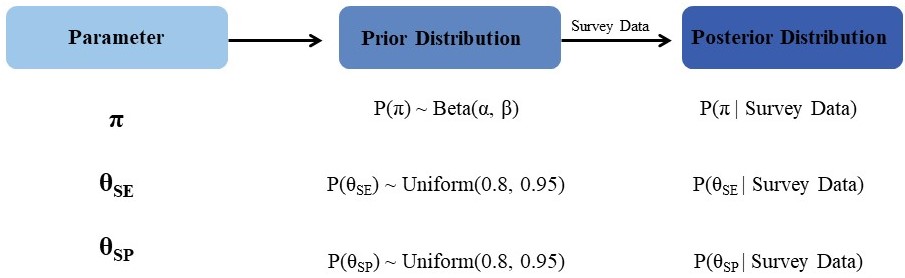
Our goal is to estimate the prevalence of dengue, P(D), in a given population based on current survey data. Such an estimate would be directly crucial in determining whether to vaccinate this population against dengue. Through equation 1 above, an estimate of P(D) also facilitates the estimation of the positive predictive value of a test, which could drive a decision to vaccinate at the individual level based on the outcome of an individual-level test. Sensitivity, specificity and prevalence (the probability of previous exposure) in equation 1 are regarded as latent variables, which cannot be directly observed. First, probability distributions are assigned to each of these latent variables to quantify their uncertainty. From a Bayesian perspective, these distributions are termed prior distributions because they are proposed before observing the outcome of the current seroprevalence survey. Next, these prior distributions are updated to posterior distributions by taking into account the outcomes of the current seroprevalence survey.
Modelling the extra complexity in equation 1 by assigning prior probabilities to the latent variables θSE, θSP and π, and then updating the PPV in light of the current data can easily be done in principle, but in practice requires numerical methods such as Markov Chain Monte Carlo. In this method, an unconditional (prior) probability is updated to a conditional (posterior) probability given the current data. We provide a brief overview of this modeling approach in the Supplementary Material.
Prior Specification
In these simulations we assume dengue seroprevalence surveys are conducted using non-serotype specific assays, namely an IgG ELISA (9–10). Uniform prior distributions P(θSE) and P(θSP) were imposed on the interval (0.8, 0.95) for both the sensitivity and specificity. The choice of a uniform prior as well as the minimum and maximum values for this distribution were chosen according to reasonable values in the literature for an IgG ELISA (1, 26). While the reported range of values for the IgG ELISA’s sensitivity and specificity are wider than this interval suggests–with values as low as 20-50% and as high as 99%–these were in the minority and most reported values fell inside this range (27–28). The uniform prior distributions may be regarded as “objective” priors; they express no particular preference for any values of θSE and θSP in the range (0.80, 0.95).
A Beta prior distribution was chosen for the latent prevalence, π, because the Beta distribution has its support on the interval (0,1) (the range of π) and because of its flexibility in accommodating a wide range of distributional shapes (29). The Beta distribution depends on two parameters, α and β, which must be designated to complete the prior specification. With respect to α and β, the mean and variance of the Beta distribution is ![]() and
and ![]() , respectively. Thus, letting πspec and σ2spec denote the mean and variance of the beta distribution, one obtains:
, respectively. Thus, letting πspec and σ2spec denote the mean and variance of the beta distribution, one obtains:

For each simulation scenario, equations 2 and 3 were used to find prior values for α and β. Table 1 summarizes the information for each simulation.
| Table 1: Summary of ten simulation scenarios (1, 26–28, 30–34). | |||||
| Prevalence | Survey Size | Prior Means | Prior Standard Deviation | Prior Prevalence | Sensitivity and Specificity |
| 0.4 | 250 | 0.3 | 0.1 | ~Beta(6, 14) | ~Unif(0.8, 0.95) |
| 0.5 | ~Beta(12, 12) | ||||
| 0.6 | 250 | 0.5 | 0.1 | ~Beta(12, 12) | ~Unif(0.8, 0.95) |
| 0.7 | ~Beta(14, 6) | ||||
| 0.8 | 250 | 0.7 | 0.1 | ~Beta(14, 6) | ~Unif(0.8, 0.95) |
| 0.9 | ~Beta(7.2, 0.8) | ||||
| 0.8 | 250 | 0.7 | 0.1 | ~Beta(14, 6) | 1.0 |
| 0.9 | ~Beta(7.2, 0.8) | ||||
| 0.8 | 250 | 0.7 | 0.1 | ~Beta(14, 6) | 0.875 |
| 0.9 | ~Beta(7.2, 0.8) | ||||
Thus, for example, with a choice of 0.3 as the prior mean, 0.4 could be regarded as representing a latent over-reported prevalence. A choice of 0.5 as the prior mean, in conjunction with the data generating prevalence of 0.4, would represent a situation in which 0.4 represents a latent underreported prevalence. Likewise, for the other triplets, (0.5, 0.7 and 0.6) and (0.7, 0.9 and 0.8), underreporting would occur, primarily because of asymptomatic or mild dengue cases where individuals do not seek medical care, or due to underdeveloped surveillance and reporting infrastructures (35–37). Overreporting, in contrast, may arise due to an excessive number of false positives resulting from ELISA cross-reactivity in patients with acute Zika infections, those previously vaccinated against Yellow Fever as well as other flavivirus infections such as Japanese encephalitis, especially in Southeast Asia (19, 38–39). While the underestimation of seroprevalence is likely to trump instances of false positive inflation, the number of false positives due to cross-reactivity is not negligible and is particularly relevant for areas with a high degree of co-circulating flaviviruses such as South America and parts of Southeast Asia.
Simulations of the Posterior Distribution of the Prevalence
To simulate the posterior distribution of the prevalence, data was first generated to represent individual tests where the probability of testing positive was set to the prevalence for that simulation; i.e. one of 0.40, 0.60, or 0.80. Hence, each test resulted in an outcome for a single individual, which was 1 if positive and 0 if negative. Taking a sample size of 250, this process was repeated 50 times for each prevalence setting. A sample size of 250 was chosen as a reasonable size to model local surveys where the prevalence is likely to change over time, in contrast to larger surveys which are more expensive to conduct, undertaken less often, and are unlikely to reflect local prevalence conditions (9, 40). Additionally, a sample size of 250 is within the reasonable range of previously conducted dengue serosurveys at the local scale (41–44). The relatively low (50) number of repetitions for each simulation was done for computational purposes, and is not thought to hamper the results or conclusions.
The posterior distribution of the prevalence for each dataset was then simulated using a Markov Chain Monte Carlo algorithm from the statistical software package R. The posterior distribution computations were repeated for 50 different data sets to investigate the potential variability in inference that could result from data collected from different studies. In each of the six simulation scenarios outlined in Table 1, a cloud of posterior probability density functions (pdfs) was produced and plotted along with the corresponding prior pdf. Table 1 provides a summary of the model specifications. For comparison, we also computed (i) the average of the posterior means of the prevalence under the (unrealistic) assumption of a test with perfect sensitivity and specificity, and (ii) the average of the posterior means of the prevalence under the assumption of a test with less-than-perfect, but known sensitivity and specificity of 0.875. This comparison was restricted to scenarios in which the probability of testing positive was 0.8 and the prior prevalence was either 0.7 or 0.9.
Figure 1 shows a diagram of our modelling sequence.
Results
Figure 2 provides a graphical display of the results of our simulations, assuming the prevalence, test sensitivity and test specificity are unobservable latent variables. Table 1 gives the specifications for these simulations and Table 2 provides a numerical summary of the results.
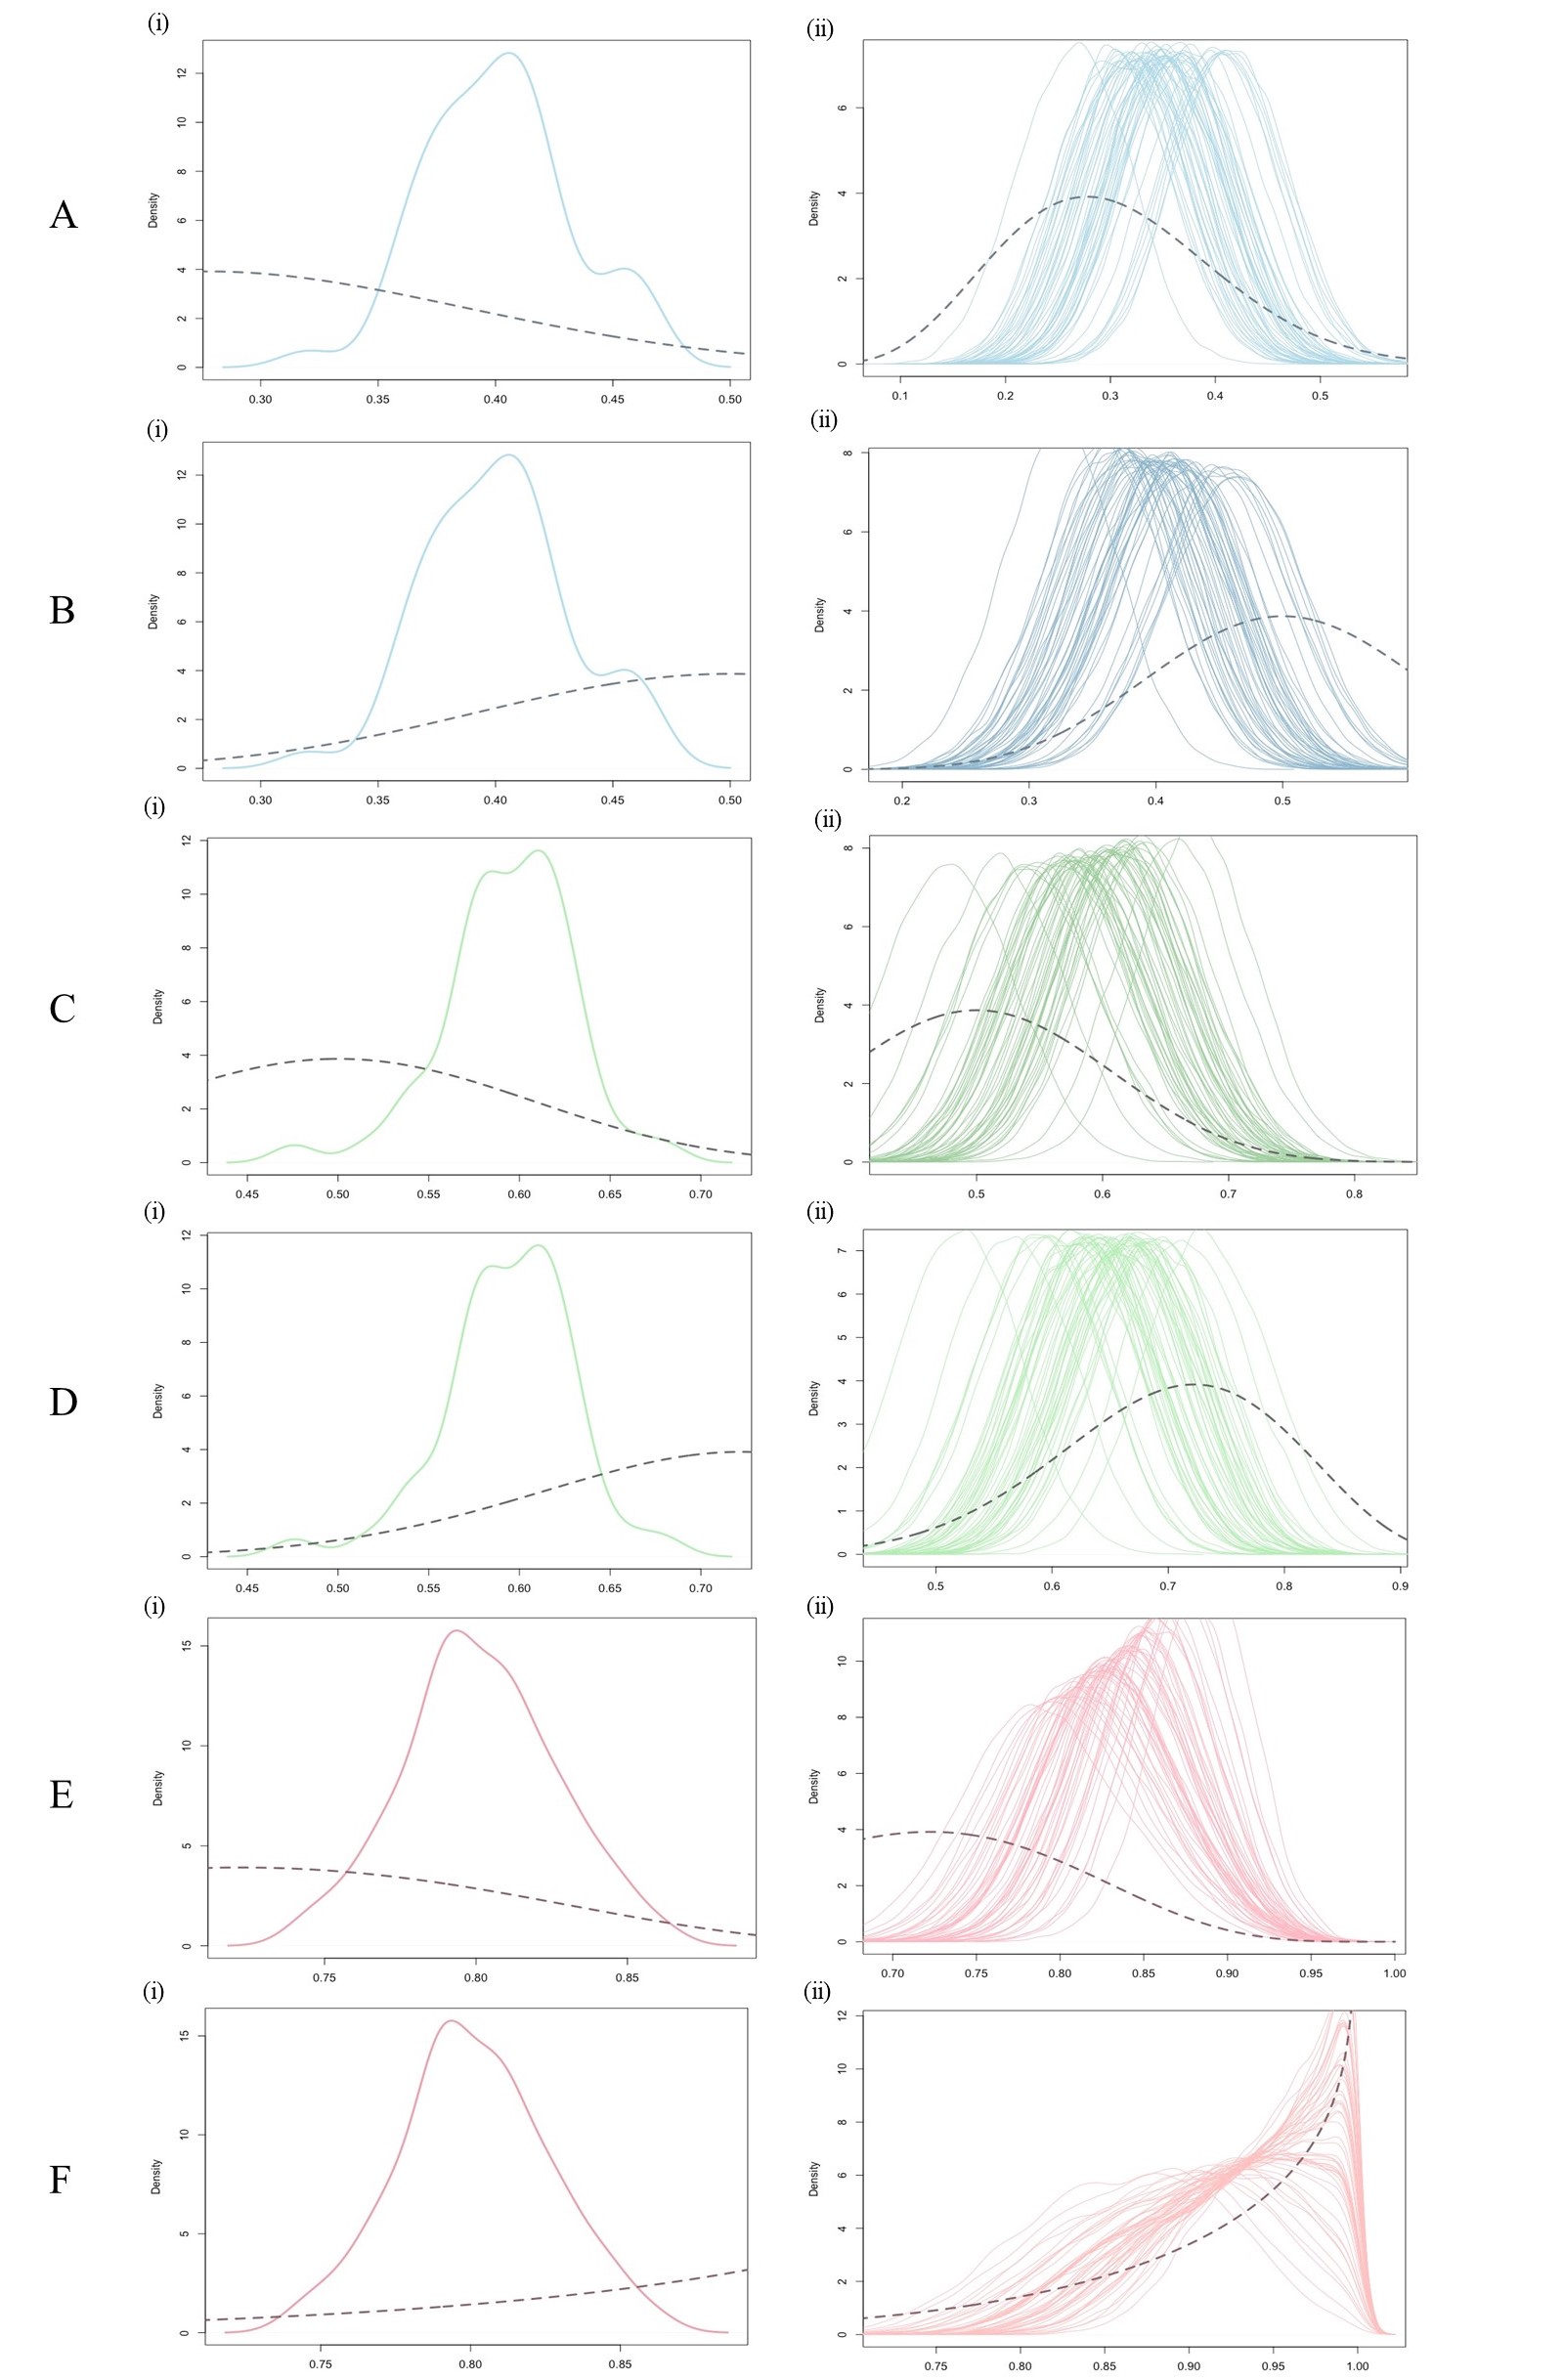
Figure 2 A(i)–F(i) depicts the prior probability density function (pdf) (dashed line) assumed for that simulation, along with a smooth line fitted to the histogram of 50 simulated data prevalences (solid line). The precise prior pdfs, and underlying prevalences used to simulate the data are described in the legend. Figure 2 A(ii)–F(ii) displays the 50 corresponding posterior pdfs, one for each simulated data prevalence. Also partially displayed is the prior pdf (dashed line) assumed for the calculation of the posterior pdf.
Figures 2 A(ii)–F(ii) demonstrate two sources of uncertainty in our estimates of the prevalence of dengue, π. First, each posterior probability density function (pdf) in the cloud shows the range of plausible values for π given the most recent observed data. This range is roughly 0.2 across all pdfs. A priori, a range of 0.4 was assumed by supposing that the standard deviation of π was 0.1; the 50 percent reduction in our initial uncertainty about the prevalence was due to the influence of the most recent data, used to update our prior beliefs about π.
A second source of variability captured by Figures 2 A(ii)–F(ii) is the variability in the mean of the posterior pdfs in the cloud. Table 2 shows that the sample standard deviation of the 50 posterior means ranges between 0.020 and 0.038. This means that in the “best” case if the posterior mean prevalence was used to estimate π, it could be under or overestimated it by as much as 0.04 (i.e. two standard deviations) depending on the most recent data used to update our prior distribution.
| Table 2: Summary of simulations for each prevalence setting. | |||
| Prior Mean | Data Prevalence | Average Posterior Mean | Average Posterior Standard Deviation |
| 0.3 | 0.4 | 0.349 | 0.033 |
| 0.5 | 0.402 | 0.030 | |
| 0.5 | 0.6 | 0.594 | 0.035 |
| 0.7 | 0.646 | 0.038 | |
| 0.7 | 0.8 | 0.837 | 0.020 |
| 0.9 | 0.922 | 0.021 | |
| 0.7* | 0.8 | 0.794 | 0.023 |
| 0.7‡ | 0.868 | 0.025 | |
| 0.9* | 0.8 | 0.804 | 0.024 |
| 0.9‡ | 0.908 | 0.032 | |
Discussion
Here, we have proposed an approach to estimating the probability of previous exposure to dengue in a population when there is no easily accessible gold standard test. Specifically, the results of these simulations demonstrate the necessity to build into such a model the inherent uncertainty in the region-specific prevalence of dengue, as well as the uncertainty in the sensitivity and specificity of the test, in this case, the IgG enzyme-linked immunosorbent assays (ELISA).
Previous work has shown that implementing the dengue vaccine in high prevalence settings (≥50-70% seropositive) may lower the burden of dengue in these areas (8). Indeed, in individuals with a previous dengue exposure, the vaccine has been shown to be effective in protecting against secondary infections (7). However, care must be taken when deciding whether or not to vaccinate against dengue. By taking into consideration extra sources of uncertainty in current seroprevalence estimates, regions considering vaccine implementation are likely to make more informed decisions and can additionally update their uncertainty in light of new seroprevalence surveys and/or diagnostic test improvements. Our approach additionally emphasizes the care that must be taken when interpreting prevalence estimates in the face of an uncertain (and unobservable) true prevalence.
For example, consider a regional population of 1 million people. A point estimate of an infection prevalence of 0.35 (that is 35,000 per 100,000) would translate to 350,000 infected individuals in the population of 1 million. However, this could be an underestimate or overestimate of the number of previously infected by as much as 76,000. Even if 76,000 is an upper bound in terms of assessing uncertainty, the effects are likely to be large from both a public health and personal risk perspective in deciding whether to vaccinate against dengue. In such circumstances, large and carefully designed studies that yield high-quality data are particularly important.
Other studies have advocated for the use of more dynamic measures of disease risk–such as the force of infection–to inform vaccine decisions (23). This is largely due to the considerable spatial and temporal variation exhibited in dengue transmission as well as sampling variability (23). Presently, however, decisions to implement the dengue vaccine are ultimately based on seroprevalence estimates obtained from surveys (11). We have, however, attempted to address these issues in the choice of a relatively small sample size (250) for our simulated data sets since these are likely to be more representative of local surveys and prevalence conditions (9,40).
Our analysis is not without limitations. Latent class models require the specification of prior distributions and inference can sometimes depend strongly on the choice of these prior distributions. We have, however, attempted to ameliorate this potential issue by choosing a Beta prior distribution for prevalence–a distribution commonly used because of its flexibility when modelling the prior distribution of an unknown parameter constrained to lie between 0 and 1. Further, in our simulations our parameter choices for the Beta prior were based on data obtained from the dengue literature, making sure to include a wide range of parameter values. Without any guidance from the literature on the distribution of the latent variables for the test sensitivity and specificity apart from their ranges, uniform prior distributions (that is, objective priors) were chosen to reflect this limitation. Additionally, a criticism sometimes levelled against latent class models concerns the assumption of conditional independence between the outcomes of different diagnostic tests (45). However, this issue does not arise in our setting, as just one diagnostic test based on the IgG ELISA was considered. When several diagnostic tests are combined however, their conditional dependence would need to be modelled. A less formal approach to combining two or more tests entails the use of composite reference standards (46).
Further, it was assumed that the initial prevalence, representing the probability of a positive test result in each trial for which the data was generated, was fixed. While this assumption may be reasonable for endemic settings where a relatively constant level of dengue is observed, areas that experience spurious epidemics may have seroprevalences that fluctuate (23, 47).
Nevertheless, these simulations provide a meaningful insight into how estimates for a population seroprevalence are influenced by taking into account two ubiquitous sources of uncertainty in circumstances where no readily available gold standard test exists. Additionally, this framework may easily be applied more broadly to other infectious diseases.
References
- Guzman M, Halstead S, Artsob H, Buchy P, Farrar J, Gubler D et al. Dengue: a continuing global threat. Nature Reviews Microbiology. 2010;8(S12):S7-S16.
- Guzman M, Harris E. Dengue. The Lancet. 2015;385(9966):453-465.
- Snow, Grace E., Benjamin Haaland, Eng Eong Ooi, and Duane J. Gubler. "Research on dengue during World War II revisited."The American journal of tropical medicine and hygiene 91, no. 6 (2014): 1203-1217.
- Guzman M, Alvarez M, Halstead S. Secondary infection as a risk factor for dengue hemorrhagic fever/dengue shock syndrome: an historical perspective and role of antibody-dependent enhancement of infection. Archives of Virology. 2013;158(7):1445-1459.
- Mondiale de la Santé O, World Health Organization. Dengue vaccine: WHO position paper–July 2016. Weekly Epidemiological Record= Relevé épidémiologique hebdomadaire. 2016 Jul 29;91(30):349-64.
- Hadinegoro S, Arredondo-García J, Capeding M, Deseda C, Chotpitayasunondh T, Dietze R et al. Efficacy and Long-Term Safety of a Dengue Vaccine in Regions of Endemic Disease. New England Journal of Medicine. 2015;373(13):1195-1206.
- Meltzer E, Bin H, Heyman Z, Schwartz E. Capillary Leakage in Travelers with Dengue Infection: Implications for Pathogenesis. The American Journal of Tropical Medicine and Hygiene. 2012;86(3):536-539.
- Flasche S, Jit M, Rodríguez-Barraquer I, Coudeville L, Recker M, Koelle K et al. The Long-Term Safety, Public Health Impact, and Cost-Effectiveness of Routine Vaccination with a Recombinant, Live-Attenuated Dengue Vaccine (Dengvaxia): A Model Comparison Study. PLOS Medicine. 2016;13(11):e1002181.
- Imai N, Dorigatti I, Cauchemez S, Ferguson NM. Estimating dengue transmission intensity from sero-prevalence surveys in multiple countries. PLoS Negl Trop Dis. 2015 Apr 16;9(4):e0003719.
- World Health Organization, Special Programme for Research, Training in Tropical Diseases, World Health Organization. Department of Control of Neglected Tropical Diseases, World Health Organization. Epidemic, Pandemic Alert. Dengue: guidelines for diagnosis, treatment, prevention and control. World Health Organization; 2009.
- World Health Organization. Informing vaccination programs: a guide to the design and conduct of dengue serosurveys. Geneva: World Health Organization; 2017.
- Thomas SJ, Yoon IK. A review of Dengvaxia®: Development to deployment. Human vaccines & immunotherapeutics. 2019 Oct 3;15(10):2295-314.
- Wilder-Smith A. Serostatus-dependent performance of the first licensed dengue vaccine: implications for travelers. Journal of Travel Medicine. 2018;25(1).
- Halstead SB, Russell PK. Protective and immunological behavior of chimeric yellow fever dengue vaccine. Vaccine. 2016 Mar 29;34(14):1643-7.
- Chatchen S, Sabchareon A, Sirivichayakul C. Serodiagnosis of asymptomatic dengue infection. Asian Pacific Journal of Tropical Medicine. 2017;10(1):11-14.
- Ochola L, Vounatsou P, Smith T, Mabaso M, Newton C. The reliability of diagnostic techniques in the diagnosis and management of malaria in the absence of a gold standard. The Lancet Infectious Diseases. 2006;6(9):582-588.
- Toft N, Jørgensen E, Højsgaard S. Diagnosing diagnostic tests: evaluating the assumptions underlying the estimation of sensitivity and specificity in the absence of a gold standard. Preventive Veterinary Medicine. 2005;68(1):19-33.
- Houghton-Triviño N, Montaña D, Castellanos J. Dengue-yellow fever sera cross-reactivity; challenges for diagnosis. Revista de Salud Pública. 2008;10(2):299-307.
- Felix A, Souza N, Figueiredo W, Costa A, Inenami M, da Silva R et al. Cross reactivity of commercial anti-dengue immunoassays in patients with acute Zika virus infection. Journal of Medical Virology. 2017;89(8):1477-1479.
- Mulherin SA, Miller WC. Spectrum bias or spectrum effect? Subgroup variation in diagnostic test evaluation. Annals of internal medicine. 2002 Oct 1;137(7):598-602.
- Shepard DS, Undurraga EA, Betancourt-Cravioto M, Guzman MG, Halstead SB, Harris E, Mudin RN, Murray KO, Tapia-Conyer R, Gubler DJ. Approaches to refining estimates of global burden and economics of dengue. PLoS Negl Trop Dis. 2014 Nov 20;8(11):e3306.
- Hernán MA, Hernández-Díaz S, Robins JM. A structural approach to selection bias. Epidemiology. 2004 Sep 1:615-25.
- Imai N, Ferguson N. Targeting vaccinations for the licensed dengue vaccine: Considerations for serosurvey design. PLOS ONE. 2018;13(6):e0199450.
- Pan-ngum W, Blacksell S, Lubell Y, Pukrittayakamee S, Bailey M, de Silva H et al. Estimating the True Accuracy of Diagnostic Tests for Dengue Infection Using Bayesian Latent Class Models. PLoS ONE. 2013;8(1):e50765.
- Speybroeck N, Praet N, Claes F, Van Hong N, Torres K, Mao S et al. True versus Apparent Malaria Infection Prevalence: The Contribution of a Bayesian Approach. PLoS ONE. 2011;6(2):e16705.
- de Souza V, Tateno A, Oliveira R, Domingues R, Araújo E, Kuster G et al. Sensitivity and specificity of three ELISA-based assays for discriminating primary from secondary acute dengue virus infection. Journal of Clinical Virology. 2007;39(3):230-233.
- Shu PY, Chen LK, Chang SF, Yueh YY, Chow L, Chien LJ. Comparison of a capture immunoglobulin M (IgM) and IgG ELISA and non-structural protein NS1 serotype-specific IgG ELISA for differentiation of primary and secondary dengue virus infections. Clinical and Diagnostic Laboratory Immunology. 2003;10:622-30.
- Peeling RW, Artsob H, Pelegrino JL, Buchy P, Cardosa MJ, Devi S, Enria DA, Farrar J, Gubler DJ, Guzman MG, Halstead SB. Evaluation of diagnostic tests: dengue. Nature Reviews Microbiology. 2010 Dec;8(12):S30-7.
- Lee, P., 1997. Bayesian Statistics. p 81-83. London: E. Arnold.
- Garg S, Chakravarti A, Singh R, Masthi N, Goyal R, Jammy G et al. Dengue serotype-specific seroprevalence among 5- to 10-year-old children in India: a community-based cross-sectional study. International Journal of Infectious Diseases. 2017;54:25-30.
- Braga C, Luna C, Martelli C, Souza W, Cordeiro M, Alexander N et al. Seroprevalence and risk factors for dengue infection in socio-economically distinct areas of Recife, Brazil. Acta Tropica. 2010;113(3):234-240.
- Low S, Lam S, Wong W, Teo D, Ng L, Tan L. Dengue Seroprevalence of Healthy Adults in Singapore: Serosurvey Among Blood Donors, 2009. The American Journal of Tropical Medicine and Hygiene. 2015;93(1):40-45.
- Velasco-Salas Z, Zambrano J, Vivas D, Sierra G, Guzmán D, Wilschut J et al. Dengue Seroprevalence and Risk Factors for Past and Recent Viral Transmission in Venezuela: A Comprehensive Community-Based Study. The American Journal of Tropical Medicine and Hygiene. 2014;91(5):1039-1048.
- Prayitno A, Taurel A, Nealon J, Satari H, Karyanti M, Sekartini R et al. Dengue seroprevalence and force of primary infection in a representative population of urban dwelling Indonesian children. PLOS Neglected Tropical Diseases. 2017;11(6):e0005621.
- Kakkar M. Dengue fever is massively under-reported in India, hampering our response. BMJ. 2012;345(dec19 17):e8574-e8574.
- Vong S, Goyet S, Ly S, Ngan C, Huy R, Duong V et al. Under-recognition and reporting of dengue in Cambodia: a capture–recapture analysis of the National Dengue Surveillance System. Epidemiology and Infection. 2011;140(3):491-499.
- Beatty M, Stone A, Fitzsimons D, Hanna J, Lam S, Vong S et al. Best Practices in Dengue Surveillance: A Report from the Asia-Pacific and Americas Dengue Prevention Boards. PLoS Neglected Tropical Diseases. 2010;4(11):e890.
- dos Santos Franco L, Gushi L, Luiz W, Amorim J. Seeking Flavivirus Cross-Protective Immunity. Frontiers in Immunology. 2019;10.
- Atchareeya A, Panthuyosri N, Anantapreecha S, Chanama S, Sa-Ngasang A, Sawanpanyalert P, Kurane I. Cross-reactive IgM responses in patients with dengue or Japanese encephalitis. Journal of Clinical Virology. 2008 May 1;42(1):75-7.
- Vanlerberghe V, Gómez-Dantés H, Vazquez-Prokopec G, Alexander N, Manrique-Saide P, Coelho G, Toledo ME, Ocampo CB, Stuyft PV. Changing paradigms in Aedes control: considering the spatial heterogeneity of dengue transmission. Revista Panamericana de Salud Pública. 2018 Jun 26;41:e16.
- Wilder‐Smith A, Foo W, Earnest A, Sremulanathan S, Paton NI. Seroepidemiology of dengue in the adult population of Singapore. Tropical Medicine & International Health. 2004 Feb;9(2):305-8.
- Ukey PM, Bondade SA, Paunipagar PV, Powar RM, Akulwar SL. Study of seroprevalence of dengue fever in central India. Indian journal of community medicine: official publication of Indian Association of Preventive & Social Medicine. 2010 Oct;35(4):517.
- Balmaseda A, Hammond SN, Tellez Y, Imhoff L, Rodriguez Y, Saborío SI, Mercado JC, Perez L, Videa E, Almanza E, Kuan G. High seroprevalence of antibodies against dengue virus in a prospective study of schoolchildren in Managua, Nicaragua. Tropical medicine & international health. 2006 Jun;11(6):935-42.
- Vincenti-Gonzalez MF, Grillet ME, Velasco-Salas ZI, Lizarazo EF, Amarista MA, Sierra GM, Comach G, Tami A. Spatial analysis of dengue seroprevalence and modeling of transmission risk factors in a dengue hyperendemic city of Venezuela. PLoS neglected tropical diseases. 2017 Jan 23;11(1):e0005317.
- Pepe MS, Janes H. Insights into latent class analysis of diagnostic test performance. Biostatistics. 2007 Apr 1;8(2):474-84.
- Naaktgeboren CA, Bertens LC, van Smeden M, de Groot JA, Moons KG, Reitsma JB. Value of composite reference standards in diagnostic research. Bmj. 2013 Oct 25;347:f5605.
- Rodriguez-Barraquer I, Cordeiro M, Braga C, de Souza W, Marques E, Cummings D. From Re-Emergence to Hyperendemicity: The Natural History of the Dengue Epidemic in Brazil. PLoS Neglected Tropical Diseases. 2011;5(1):e935.
Supplementary Material
Antibody-Dependent Enhancement
Consistent with the majority of viral infections, following a primary dengue infection, the body first produces IgM antibodies as part of the body’s non-specific response, which activates the production of IgG antibodies (1). IgG antibodies can then bind to viral antigens and deliver the virus to macrophages (2). After the dengue virus is cleared from the body, immune cells become dormant. In the event of a second infection with a heterologous viral serotype, immune cells become activated and immediately release the anti-dengue IgG antibodies (2,3). Because all four dengue serotypes are related, the IgG antibodies are able to bind to the new dengue antigen, but because it is not the same virus that caused the first infection, the antibodies cannot deactivate the most virulent part of the virus (2,3). When the virus is subsequently delivered to macrophages, it is able to hijack the macrophages’ cellular processes and use its resources to multiply, resulting in viremia with viral loads sometimes 1000 times those of primary infections (2, 3). This phenomenon is known as antibody-dependent enhancement.
The dengue vaccine is thought to act as a primary infection in some dengue-naïve individuals (4). Thus, if and when those individuals are exposed to one of the four dengue serotypes, they become vulnerable to this phenomenon and, subsequently, to a severe dengue infection (that is, dengue hemorrhagic fever and dengue shock syndrome).
Model Specification
Even though the sensitivity and specificity are parameters characteristic of a diagnostic test and the seroprevalence is also a parameter–determined by many different factors–their true values are unknown. In latent class models, the uncertainty in such parameters is modelled by assigning them probability distributions, known as prior distributions. Once the current data are observed, these prior distributions are updated to posterior distributions using Bayes’ Theorem. The post-data output is therefore not a point estimate of each parameter, but rather a full distribution of possible parameter values, reflecting our updated uncertainty in each parameter. Nevertheless, as a “point estimate”, one may choose a representative of the posterior distribution; commonly its mean or mode. Gross misspecification of the prior distribution, however, is likely to lead to biased (posterior) estimation of the unknown parameters by the posterior mean. For this reason, the prior should be chosen with care. Posterior credibility intervals play the role of confidence intervals; a 100(1–α)% posterior credibility interval for a given parameter has the property that with posterior probability (1–α) the given parameter falls in this interval.
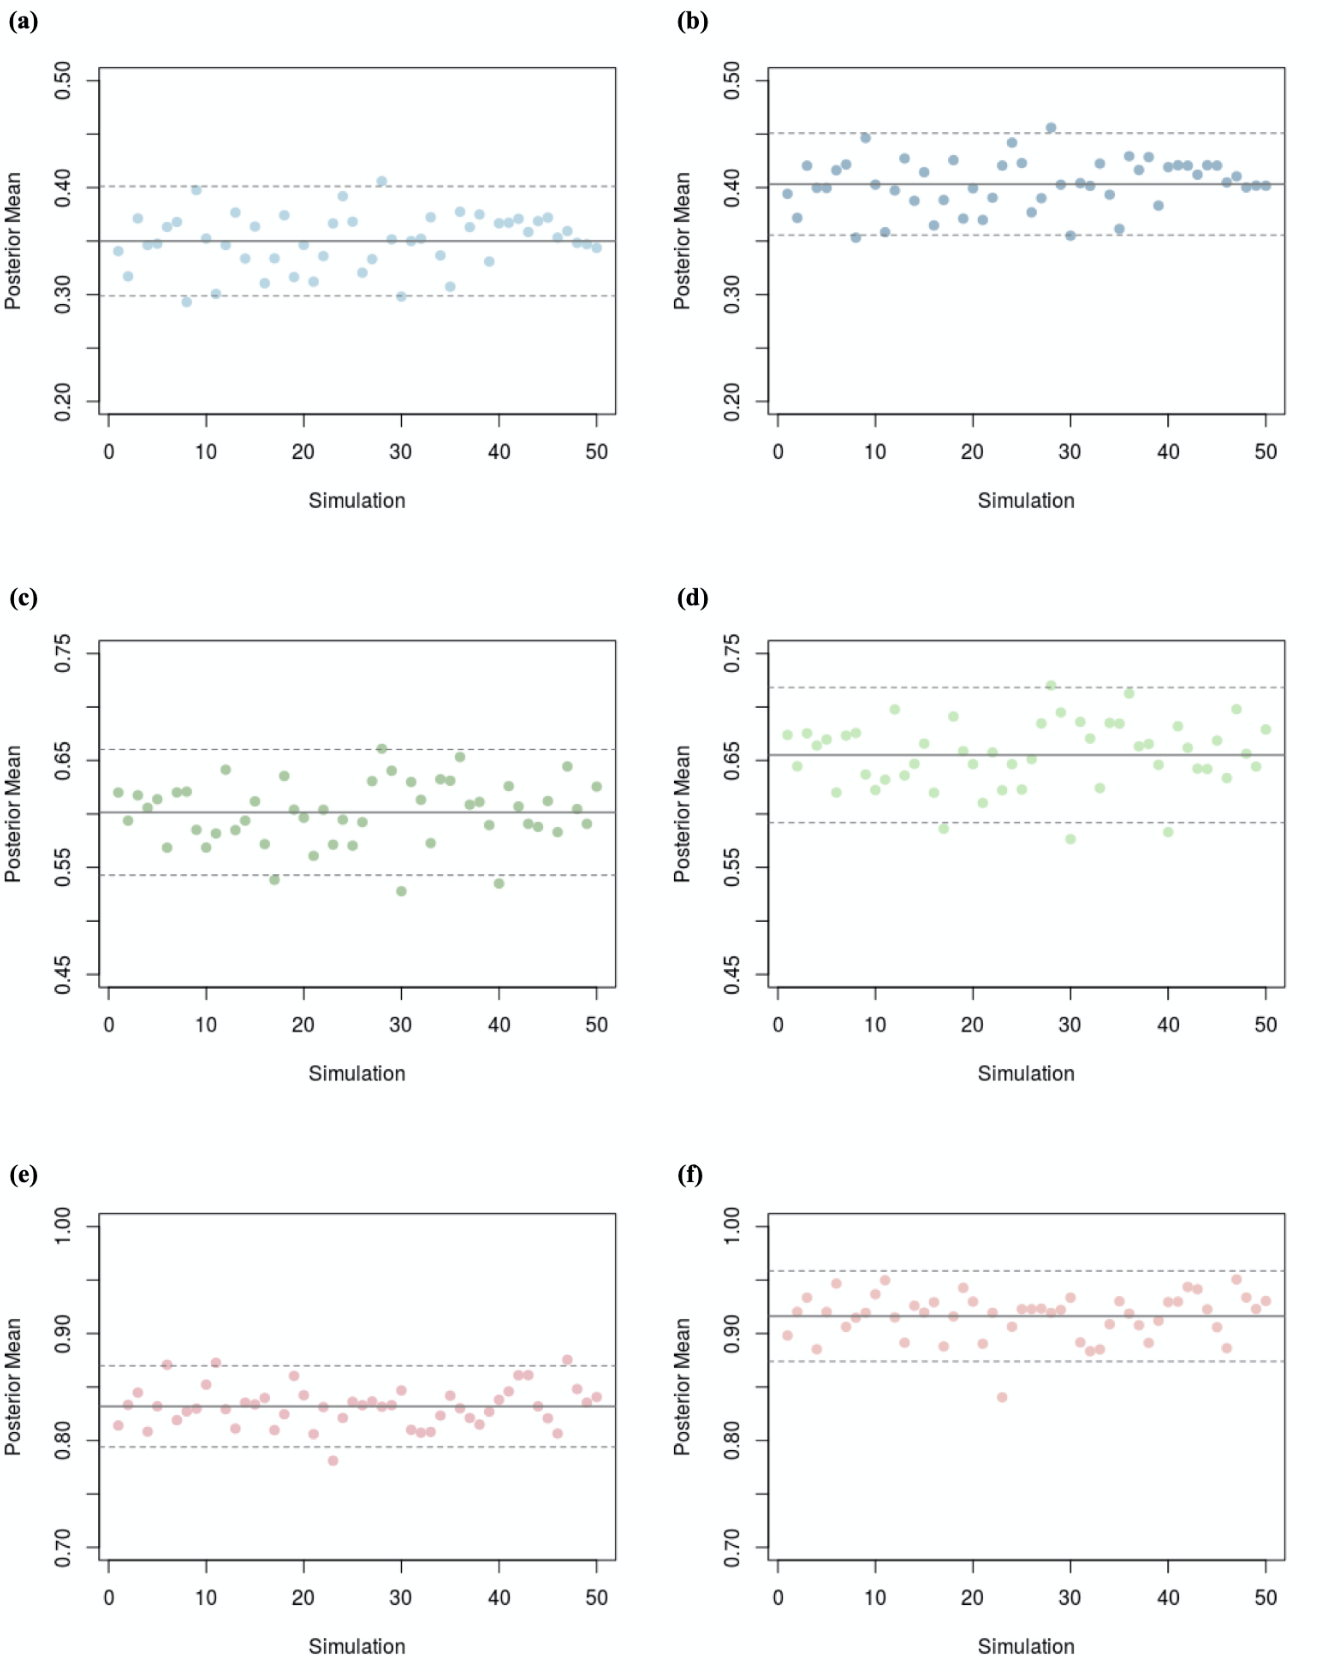
We do not display a single posterior distribution obtained from a single data but rather, for each seroprevalence setting, we generated 50 data sets, and, for each, we display a cloud of 50 posterior distributions for dengue prevalence. We did this to investigate the variability in posterior distributions that may result from different seroprevalence surveys.
We do not provide the posterior distributions of the test sensitivity and specificity since the focus is on the prevalence of dengue rather than the properties of the test; that is, sensitivity and specificity. However, these posterior distributions are needed in order to derive the posterior distribution of the dengue seroprevalence.
Further, we did not compute posterior credibility intervals because there is no suitable way to summarize 50 intervals from 50 different data sets. In practice, an analyst working with a single data set would present their posterior credibility interval.
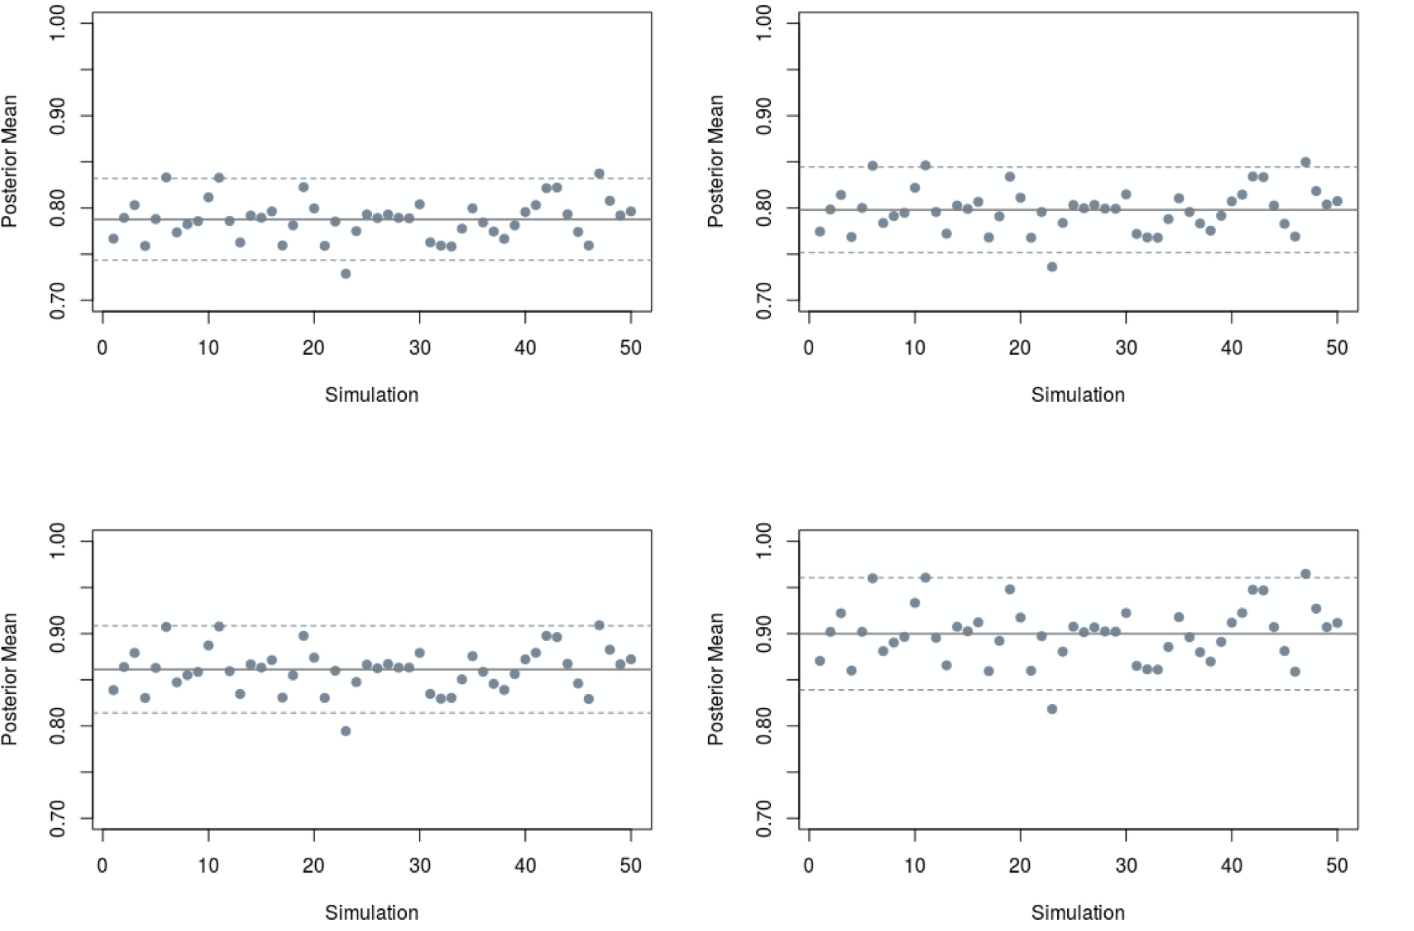
Figure S1 shows the variability in the seroprevalence posterior means as a function of 50 observed data prevalences. Each posterior mean may be used as a summary of the posterior distribution obtained from its corresponding observed data prevalence. Hence, the posterior mean could be regarded, in each case, as a point estimate of the “true” prevalence.
References
- Guzman MG, Halstead SB, Artsob H, Buchy P, Farrar J, Gubler DJ, Hunsperger E, Kroeger A, Margolis HS, Martínez E, Nathan MB. Dengue: a continuing global threat. Nature reviews microbiology. 2010 Dec;8(12):S7-16.
- Halstead, S.B., 2002. Dengue hemorrhagic fever: two infections and antibody dependent enhancement, a brief history and personal memoir. Revista cubana de medicina tropical, 54(3), pp.171-179.
- Morens DM, Halstead SB. Measurement of antibody-dependent infection enhancement of four dengue virus serotypes by monoclonal and polyclonal antibodies. Journal of general virology. 1990 Dec 1;71(12):2909-14.
- Halstead SB, Russell PK. Protective and immunological behavior of chimeric yellow fever dengue vaccine. Vaccine. 2016 Mar 29;34(14):1643-7.

This work is licensed under a Creative Commons Attribution-NonCommercial-ShareAlike 4.0 International License.